Introducing CarDekho Car Testing - The Scientific Way
Bringing Science to Testing Cars
For the first time in India, a dedicated team of test engineers at CarDekho has been conducting scientific tests for each car using advanced equipment and specialized testing procedures. We focus on specific areas of the car while testing them. We also ensure that, right from the suspension to the seat comfort, we have covered it all. These tests helped us acquire lots of scientific data and readings regarding various aspects.
To simplify things, we have come up with a scale from 0-100 for each aspect of the car.
How do we test?
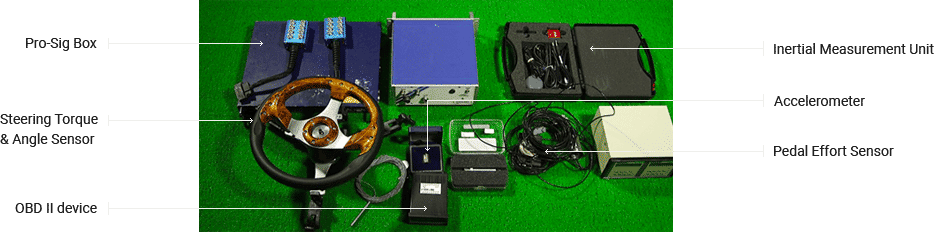
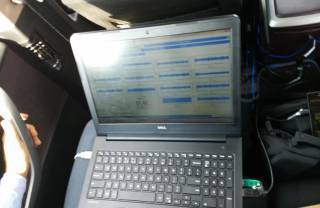
Our team of professional car testers use scientific instrument and compile loads of data to rate every car in India. You can see the equipment being used by the testing engineers in the picture. It includes -
There are four main categories that are focused upon by these tests:
Noise, vibration and harshness
Seat comfort and suspension efficiency
Steering and pedal effort
Acceleration and Braking
Noise, Vibration and Harshness (NVH) Test
What is measured?
Commonly known as NVH test, this measures the amount of noise you can hear in the vehicle, both from the driver's and passenger's perspective. This can help determine the level of comfort in a vehicle. This test is also used to measure vibrations that occur at various points in the vehicle. If these vibrations are too high, the drivers (and also passengers) experience some level of fatigue over long journeys.
The testing equipment
1. ProSig Box - This is the soul of the testing equipment
2. Connectors - As the name suggest, these are responsible for connecting the sensors and microphones to the Pro-Sig Box.
3. Microphones - Highly sensitive microphones are set up at just about ear level both near the driver's seat and rear left passenger's seat. If the vehicle is an MUV/SUV with three rows, they are set up at ear level in the third row. The microphones maintain same distance from seat H point. They try to mimic human hearing in that they capture noise in the cabin just as a human ear would.
4. Seat pad vibration sensor - The vibrations that are transmitted to the driver and passengers through the seat are measured by this sensor.
5. Uniaxial and triaxial accelerometers - These are attached to components like the gear lever and steering wheel, that again transmit vibrations to the driver from the mechanical components.
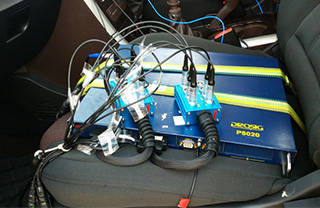
Pro-Sig Box with connectors
The normal standards of measurement
Usually sound is measured in decibels (dB). In these tests, the units used are dBA (decibels A-weighted). These are an expression of relative loudness of sounds in air as perceived by the human ear. Below, you can see a comparison table of various sounds and their dBA levels.
A term called "Articulation Index" is used as a measure of level at which people in the car can converse in a normal manner without having to raise their voice due to engine noise and wind noise. Other factors that might ability to converse include the sound of an over-revving engine or the noise that seeps into the cabin when the vehicle is driven at low rpm in high gear.
The accelerometers and seat pad sensors give out reading that are in meters per second squared (m/s2). These measurements are sent to the Pro-Sig box, where they are recorded for analysis. Readings are taken at different speeds like 40, 60, 80 and 100 kmph over smooth as well as rough roads. This is done so as to account for all the different road conditions that one might come across.
Sound Level (in dBA) & Effect
=60
Ambient noise in diesel car at normal speed. Petrol cars have even lower levels.
70
Acceptable noise level in a car travelling at 80-100kmph
115
Sound from a truck's air horn
120
Harmful to the human ear
High-sensitivity Microphone set up to measure noise
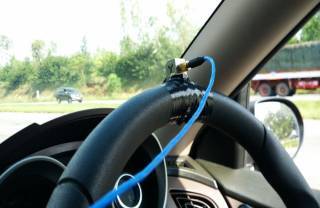
Accelerometer mounted on steering wheel to measure vibrations
Live data being recorded in a Laptop by the Testing engineers
Factors affecting the readings
As expected, the results of this test vary considerably from car to car. This can be due to:
Aftermarket modifications to the vehicle (tyres, suspension, etc.)
Thickness of seat cushions
Types of door beading
Thickness of door pads, roof liner.
OEMS also provide engine covers to reduce noise, especially in diesel engines.
Our in-house team has stuck to cars that are in completely stock condition and have clocked less than 15,000 km on the odometer.
The Testing Process
It takes a few hours to completely set up the equipment for each car. The different locations for each component are as follows:
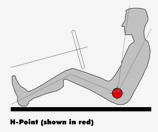
1. Microphones – These are set up at 700mm ( ±50mm ) above the Seat H-point and 120 mm in front of the head rests.
2. Accelerometers – These are mounted at locations like the steering wheels, gear levers.
3. Pro-Sig Box –This is strapped in place on the co-driver's seat
4. Set pressure sensors – These are just placed on the seats of the drivers and passengers.
The data from the sensors is collected by the Pro-Sig and this is in turn fed to the testing team's laptops. The sound and vibration levels are captured continuously. The driving conditions for the car both on smooth and rough roads are:
40 kmph
in third gear
60 kmph
in third, fourth, fifth and/or sixth gear
80 kmph
in top gear
100 kmph
in top gear
Recording Results
All this data that is churned out by the sensors every second has to be consolidated and laid out in a simple manner so that even a layman can understand what is being done. So, our testing team gives each car a relative score on a 0-100 scale.
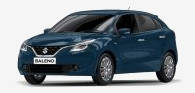
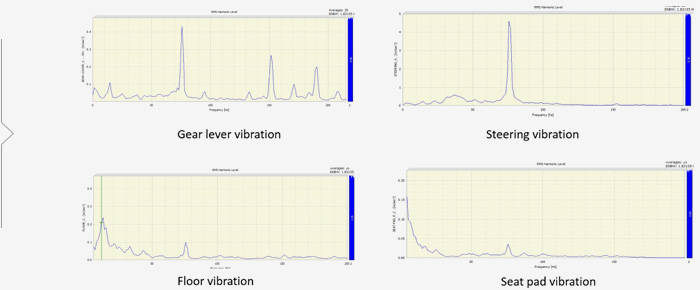
Readings of Vibrations in Maruti Baleno
Bands assigned for relative scoring
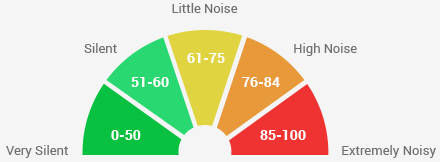
Noise Levels
Very Silent
Score 0-50
A car that falls in the very silent zone is one in which you have a good AI (articulation index), which means you can carry on a normal conversation between occupants in the car without engine, wind or road noise intruding on your conversation and forcing you to raise your voice even when the car is driving at high speeds.
Silent
Score 51-60
A silent car is one where engine noise, wind noise and road noise is perceptible in the cabin, but it still does not bother the occupants and one can have a normal conversation in the car.
Little Noise
Score 61-75
A car that falls in the Little Noise category is one where there is some engine noise and wind noise felt in the cabin which may cause irritation to occupants. This is usually caused by insufficient sound damping material in the doors and bonnet or where the build quality of the car is fairly light, using thinner metal panels.
High Noise
Score 76-84
Cars that fall in the High Noise category are ones where there is significant engine noise, road noise and wind noise at high speed, leading occupants to feel fatigued after a long trip and they will need to talk louder in the cabin to be able to hear each other.
Extremely Noisy
Score 85-100
Cars that fall in the extremely noisy category are ones that are likely to be fairly uncomfortable for long trips as the occupants will find the noise levels in the cabin irritating beyond a point.
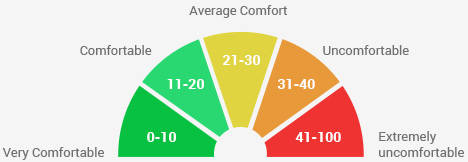
Vibration Levels
Very Comfortable
Score 0-10
Cars that fall in the very comfortable zone are ones where the occupants will feel very little vibrations from the body or seats in the cabin, even when the car is driving at high speeds. Good insulation, seat cushioning and suspension are responsible for low vibration levels.
Comfortable
Score 11-20
Cars that fall in the comfortable zone are those in which there is some perceivable vibrations in the cabin, but none that will bother the occupants. The occupants will be able to feel that the car is running, but won't be bothered by the vibration.
Average Comfort
Score 21-30
Cars that fall in the average comfort zone allow some vibrations to filter through to the occupants. This is more so for the driver as he would usually feel vibration through the pedals, steering and gear, while the passenger feels it mainly in the seat. It does not affect comfort drastically on a long trip.
Uncomfortable
Score 31-40
Cars that fall in the uncomfortable category are those that have excessive levels of vibration, which begin to take their toll on occupants over a long journey causing some tiredness.
Extremely uncomfortable
Score 41-100
Hardly any cars should fall in this category, because if they do it indicates a serious flaw in either the suspension, engine mounts or some other component, causing high levels of vibration that can be annoying to occupants.
Seat Comfort and Suspension Efficiency
What is measured?
The Seat Comfort Test will measure whether your car seats are comfortable enough for short and long journeys. Maybe, they are so good that you can sleep in them too. You never know. The Suspension test will determine whether you can sleep in them even while the car is moving. In other words, it will give you an idea about the ride quality of the car and how good it is at soaking in bumps.
The testing equipment
All these sensors are connected to the Pro-Sig box.
1. Seat pressure mapping membrane -This is a highly sophisticated piece of equipment. It is a membrane that is placed over the seat. It has squares on it (1 cm2 in area), each of which generates a heat-map that measures the pressure exerted on the driver by the seat.
2. Accelerometers - Tri-axial Accelerometers are placed on the floor, steering and dash.
3. Speed Breaker – A plastic coated rubber speed breaker of height 50mm and width 350mm is used as a speed breaker in these tests.
The normal standards of measurement
The pressure exerted is measured in kg/cm2. This is the pressure exerted by the seat on the driver's hips, thighs and back. The standard driver used for this test weighs 68 kg and is 5'7" in height. We usually store him in a closet until we need him for tests like these. The seat is adjusted so that the driver can get a proper view of the road and also access the pedals comfortably. In such a scenario, the overall pressure distribution is tracked using the membrane sensor on the seat.
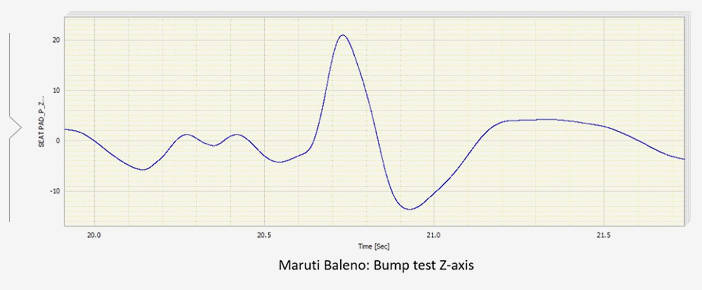
Vibrations are measured when the car goes over a speed breaker. The vertical movement if also tracked to see how the passengers are affected due to the bump. The vibrations are measured in m/s2. Speed of the car during this tests is 20 kmph.
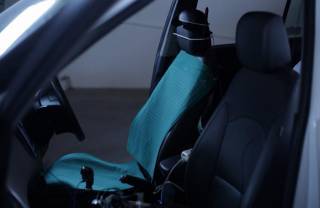
A membrane sensor placed on the seat to measure pressure exerted by the seat on the driver.
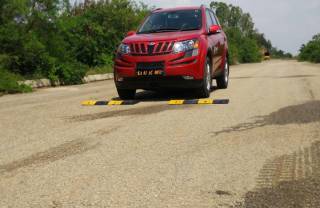
A car passing over the speed bumps during a suspension and comfort test
Factors affecting the readings
Factors that determine seat comfort are:
Quality of seat covers
Foam density in the seat
Angle of seat incline
Factors that determine Suspension efficiency are:
Tyre size
Tyre pressure
Suspension type (dependent/independent and sub-types)
The Testing Process
For seat comfort:
1. The seat membrane sensor is laid out over the driver's seat. The driver will drive the car for about 2 km on a smooth road with normal gear shifts and a heat map is generated.
2. A static test is done where the driver sits in the car with the seat angled to his optimum level for 10 minutes. The heat map for this condition is generated.
For suspension efficiency:
1. The car is driven at 20 kmph with two people and 30 kg of luggage on-board, over the speed-bump of dimensions mentioned earlier. The vertical movement is measure by accelerometers.
Recording Results
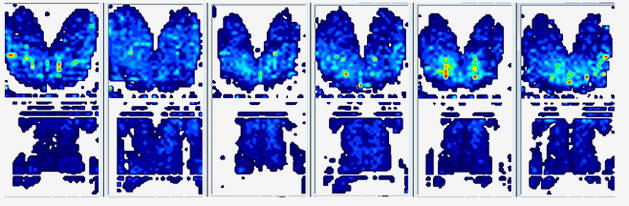
In the heat maps, the areas of peak pressure are shown in red, and the blue and yellow areas indicate low to moderate pressure. Since all this is again a lot of data to process, the rating is given on a 0-100 scale, where the lower score indicates a better seat.
For suspension also, the vertical movement is averaged out for all cars belonging to a particular segment, and each car is given a score between 0-100 where a lower value indicates better efficiency.
Heat Map :
Heat map generated by driver position in various cars. The lower half of the image shows heat-maps for driver's back and seat interaction. The upper half shows the same for driver's lower body and thighs interaction with the seat.
Readings of Vibrations in Maruti Baleno
Graph showing a Baleno moving over a speed bump. Deviation in Z-axis is recorded
Bands assigned for relative scoring
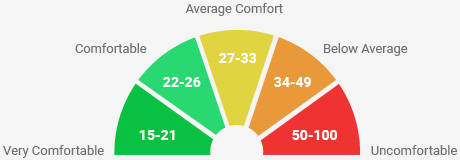
SEAT COMFORT
Very comfortable
Score 15-21
A car with a very comfortable seat is one where there would be hardly any red areas seen in the heat map during the test. This is one that has good all-round support for the back, lumbar support and under thigh support, and is comfortable for long drives.
Comfortable
Score 22-26
A car with a comfortable seat would be one that provides adequate support most of the time. The firmness of the cushioning and the contours of the seat play an important part here.
Average Comfort
Score 27-33
A car with a seat that falls in the average comfort category is one where the occupants would be comfortable on most trips, but long journeys could be a little tiring.
Below Average
Score 34-49
A car whose seat comfort falls below average is one which is best suited for short journeys only, as long trips could prove to be tiring to the driver and/or passengers.
Uncomfortable
Score 50-100
Very few car seats fall in the uncomfortable category unless they are jump seats or third row seats set in a cramped position, which again would be best suited for short trips only.
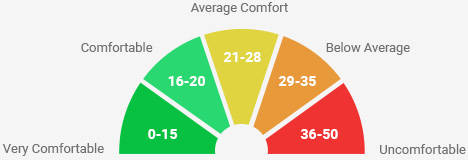
SUSPENSION BUMP TEST
Very comfortable
Score 0-15
A car that scores in the very comfortable zone on the suspension bump test is one that has a good suspension and thick absorbent seats. This will ensure good comfort over bad roads.
Comfortable
Score 16-20
A car with a suspension that falls in the comfortable zone is one that has a good balance between ride and handling, keeping occupants insulated from the road.
Average Comfort
Score 21-28
A car whose suspension falls in the average zone is one which has good ride quality for the most part, but sharp bumps do filter into the cabin and can be felt by occupants.
Below Average
Score 29-35
A car that has a score of below average on the suspension bump test is one with a pretty stiff suspension and inadequate cushioning resulting in jolts from bad surfaces on the road.
Uncomfortable
Score 36-50
Very few cars would fall in the uncomfortable zone. These are usually cars that have a pretty stiff suspension set up, usually seen on purpose-built off-road vehicles or those meant to carry heavier loads.
Steering Effort and Pedal Effort Test
What is measured?
This test measures the effort it takes to turn the steering from lock to lock, both when the car is stationary and in motion. The number of turns take to go from lock to lock is also measured. Apart from this, the test also measures the force required to be exerted on the clutch pedal while shifting gears. This is an essential detail especially for cars commuting in jam-packed city traffic.
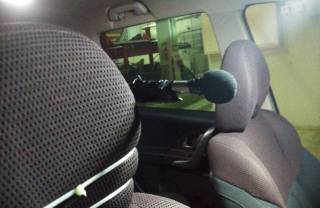
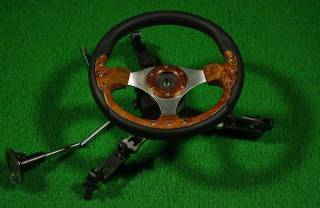
Steering torque and angle sensor
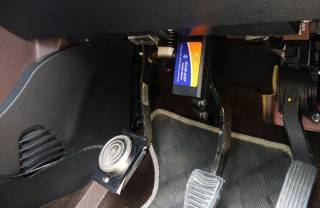
Pedal sensor attached to the clutch pedal. The small car-like part is a Bluetooth OBD-II reader connected to the ECU port of the car
The testing equipment
1. Steering torque and angle sensor -This is fitted on top of the original steering. As the name suggests, it measures the torque required to turn the steering wheel through a certain angle at different speeds of the vehicle.
2. Pedal force sensor - This measures the forced exerted on the pedal.
3. Gear level force sensors - This sensor sits parallel to the gear knob and senses how much force the driver has to exert on it to shift gears.
The normal standards of measurement
The effort for shifting gears is measured in kgf. The number of turns from lock to lock is measured in angles (one full turn is 360 degrees), while the effort (torque) is measured in Nm. Steering effort is measured in N-m (newton-meters).
Factors affecting the readings
One of the biggest factors is the condition in which the vehicle is in. We have taken vehicles in stock condition with less than 15,000 kms on the odometer, just like the ones used for the NVH test. This was done to avoid the influence of wear and tear of the components on the test data.
The type of steering should also be taken into account - Electronic/Hydraulic power assist. Even clutches are usually of two types- Hydraulic and Cable-operated.
The Testing Process
To measure the steering effort:
Case 1. The vehicle is driven at 10-15 kmph on a normal road. A U-turn is taken. This is repeated five times and an average reading is taken.
Case 2. The steering is turned from lock to lock while the vehicle is stationary and the engine is running.
To measure the clutch pedal effort:
Case 1. The clutch pedal is applied and released repeatedly at a low vehicle speed so as to mimic jam-packed traffic conditions. Note: The tester does not slam his foot on the clutch.
Case 2. The vehicle is driven for 2 km in no traffic and normal gear shifts are recorded.
An average between readings of Cases 1 and 2 is taken.
All these readings are received from the sensors by the Pro-Sig box and then transferred to the tester's laptop.
Recording Results
As mentioned earlier, and average of five readings are taken. Similarly, an average of values of all cars in a segment is taken as segment average. If an individual car has a value above this average, it is said to have "heavy steering". If it is below, it is said to have a "light steering". Ditto for the clutch readings.
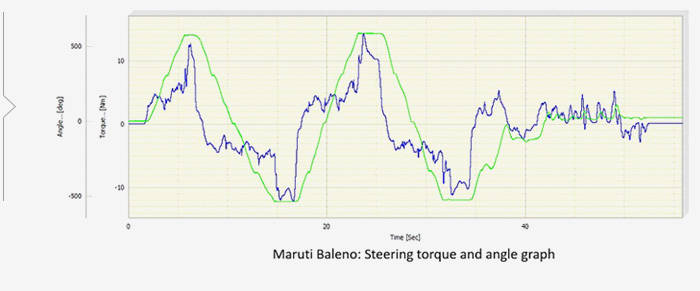
Readings of Vibrations in Maruti Baleno
Bands assigned for relative scoring
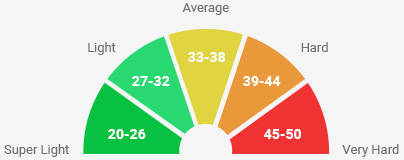
Steering Effort
Super Light
Score 20-26
Cars that have a super light steering are those that require little to no effort to turn. While that may be a good thing in heavy traffic, it is something that enthusiasts don't quite like as the car does not provide enough feel of the road at high speeds.
Light
Score 27-32
A car with a light steering is one that is easy to turn at standstill and yet has decent levels of resistance, giving the driver a greater feeling of control.
Average
Score 33-38
Cars that fall in the average zone for steering effort are those that offer a good balance between ease of turning the steering and enough heft to provide a good driving feel.
Hard
Score 39-44
Cars that fall in the hard category are those that would need significantly more effort to turn at low speeds and could lead to fatigue on winding roads. High speed, long-distance drivers would prefer this type though.
Very Hard
Score 45-50
Those cars that have a very hard steering are not suitable for parking in tight spots or taking turns at slow speeds, as they would cause a lot of driver fatigue.
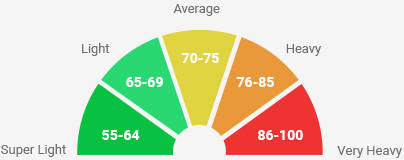
Clutch Effort
Super Light
Score 55-64
A car with a super-light clutch is one that will be very easy to drive in bumper-to-bumper traffic conditions as frequent use of the clutch will not tire the driver.
Light
Score 65-69
A car with a light clutch is one that is easy to drive in high traffic conditions and yet provides some level of resistance to the driver for better control.
Average
Score 70-75
Cars with a well-balanced clutch that is neither too light nor heavy are ones that are suited to longer distance driving where very frequent use of the clutch is not needed.
Heavy
Score 76-85
Cars with a heavy clutch are best not used in extreme traffic conditions as they will tire out the driver with frequent use of the clutch.
Very Heavy
Score 86-100
A vehicle with a very heavy clutch could be good for heavy load-hauling applications, but would be extremely difficult to drive in bumper-to-bumper traffic conditions.
Acceleration and Braking Test
What is measured?
This test measures how fast a car can go in a straight line from 0-60 kmph and 0-100 kmph. It also measure the time and distance taken to come to a complete halt from a speed of 100 kmph.
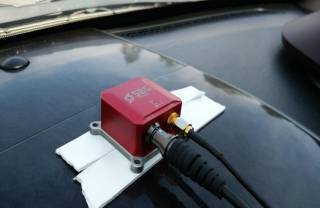
The testing equipment
1. Inertial Measurement Unit with GPS -This is a device attached to the car's dashboard. It has a clear view of the sky so as to obtain a lock on vehicle location via GPS. The inertial sensor in tandem with the GPS measures acceleration multiple times per second.
2. OBD II Reader - This is a device that captures data from the ECU of the car by connecting to the on-board diagnostics port of the car.
The normal standards of measurement
The inertial measurement unit with GPS and OBD reader are connected to the car. Acceleration is measured in seconds against kmph, i.e., 0-100 in X seconds. Braking is also measured in the same units.
Inertial measurement unit with GPS, used to measure vehicle velocity
Factors affecting the readings
Both acceleration and braking are affected by similar factors like:
Tyre pressures
Clutch behavior
Gear shift patterns
Braking alone is affected by whether the car has ABS (Anti-Lock Braking system).
The Testing Process
For Acceleration:
The car is accelerated from standstill with two people and 30kg luggage and about 50% fuel, on a normal smooth tarmac. The car is accelerated till its speed it slightly above 100 kmph. This is repeated for five runs and an average is taken to even out irregularities in gear shifting patterns.
For Braking:
The same car (with 150 kg payload this time) is then braked at a specific point in the same straight line at 100 kmph. The distance traversed and time taken to come to a complete standstill are noted. Five such runs are conducted and an average is taken.
Recording Results
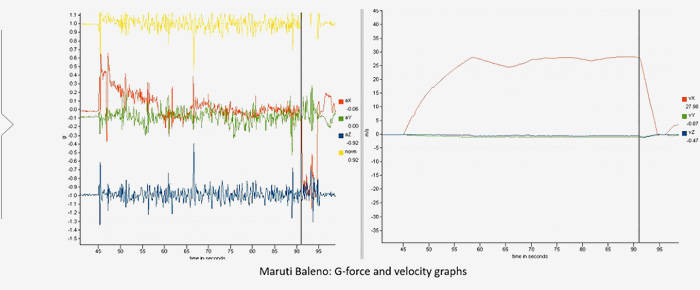
Generally, a car with lighter curb weight and bigger brakes performs better in these two tests. The g-forces acting on the car are also tabulated. Lower the score, better the performance.
Readings of Vibrations in Maruti Baleno
Bands assigned for relative scoring
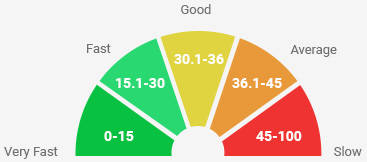
Acceleration
Very Fast
Score 0-15
A car that falls in the Very Fast band for a 0-100 kmph time, is one that usually has a time of less than 5 seconds to get to 100 kmph. Most road going cars (except for super cars and some luxury cars) are above that time.
Fast
Score 15.1-30
Cars that have an acceleration time of below 10 seconds to get to 100 kmph fall in the Fast band. These include a few hatchbacks and sedans.
Good
Score 30.1-36
Most cars with good power-to-weight ratio fall in the good band for a 0-100 kmph time of 12 seconds.
Average
Score 36.1-45
Cars that take between 12 seconds to 15 seconds to reach 100 kmph fall in this category.
Slow
Score 45-100
Cars that have a 0-100 kmph time of more than 15 seconds fall in the slow category.
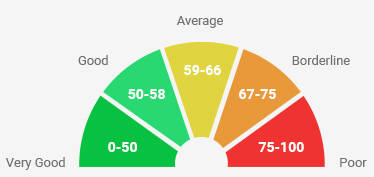
Braking
Very Good
Score 0-50
A car with sharp brakes that stops in a shortest distance falls in the very good category. This would usually include cars that have a very good distribution of brakes and a excellently tuned ABS with an all disc set up and grippy tyres.
Good
Score 50-58
Cars that have good bite on their brakes with good ABS setup and stop in reasonably short time and distance fall in the good category.
Average
Score 59-66
Cars that have decent enough brakes with ABS, but have scope for improvement to further tune the ABS settings to reduce stopping time and distance fall in this category.
Borderline
Score 67-75
A few cars fall in the borderline category even though they are equipped with ABS. These are usually cars that are too heavy with inadequate dynamics and brakes.
Poor
Score 75-100
Cars without ABS and with inadequate braking and poor tyres would fall in the poor category and would best be driven at slower speeds.
The Baleno scored 75 and 76 respectively for driver and rear passenger noise. So, it has turned out that according to our band-wise scoring, the Baleno falls in the
Little Noise (Score 61-75) category for the driver and
High Noise (76-84) category for the rear passenger.
Little NoiseFor Driver
SilentFor Passenger
In contrast, the Jazz scored 62 and 51. So, the Jazz is in of the
Little Noise (Score 61-75) category for the driver and
Silent (Score 51-60) category for the rear passenger. From this, we can conclude that, under test conditions, the Honda Jazz is quieter inside.
Vibration Level
Average ComfortFor Driver
Comfortable For Passenger
Similarly for Vibration levels, the Baleno scored 24 for driver and 13 for rear passenger. This puts it in the
Average Comfort (Score 21-30) category and
Comfortable (Score 11-20) category for driver and rear passenger respectively.
Comfortable For Driver
ComfortableFor Passenger
The Jazz on the other hand, has scored 19 for vibrations from driver's perspective and 13 for rear passenger, putting both in the
Comfortable (Score 11-20) category. So, under test conditions, it can be said that the journey in the Jazz is smoother.
So, under test conditions, it can be said that the the Honda Jazz is quieter inside and journey in the Jazz is smoother.
Sample result for Seat comfort and Suspension Efficiency test
Maruti Baleno 1.3 Alpha
VS
Honda Jazz V iDTEC
Seat Comfort test
Average ComfortFor Driver
Average ComfortFor Passenger
When assigning the score on a scale of 0-100, it was found that the Baleno scored a 28 for driver and 27 for passenger. This puts it in the
Average Comfort (Score: 27-33) category.
Average ComfortFor Driver
Average ComfortFor Passenger
The Jazz scored a 31 for both driver and passenger, putting it in the
Average Comfort (Score: 27-33) category too. It can be said that the Baleno is marginally more comfortable than the Jazz.
Suspension Efficiency test
ComfortableFor Driver
Below AverageFor Passenger
The Baleno scored a 20 for driver and 33 for passenger and falls in the
Comfortable (Score: 16-20) category for driver and
Below Average (Score: 29-35) for passenger.
Average ComfortFor Driver
Uncomfortable For Passenger
The Jazz, in contrast, scored 25 and 45 for driver and passenger. This puts it in the Average Comfort (Score: 21-28) and Uncomfortable (Score: 36-50) bands for driver and passenger respectively. This does not bode well for the Jazz as the Baleno proves to be much better in these aspects.
On a 0-100 scale, the Baleno scored 33 while the Honda Jazz scored 34. Here again, the lesser the score, the better. According to our band-wise classification, both cars would fall in the Average (Score 33-38) category when it comes to Steering Effort.
Clutch effort:
LightFor Driver
AverageFor Driver
For the Clutch Effort, the Baleno has scored a 65 and the Jazz a 70. Accordingly, the Baleno falls in the Light (Score 65-69) band while the Jazz is in the Average (Score 70-75) band. Again, the Baleno outscores the Jazz by having a lighter Clutch.
So, the Baleno has a marginally better steering than the Jazz under test conditions. Again, the Baleno outscores the Jazz by having a lighter Clutch.
The Baleno scored a 36 on the acceleration test which places it in the Good (30.1-36) category. The Jazz falls in the Average (36.1-45) category as it scores a 38. So, the Baleno proves to be a quicker car off the mark compared to the Jazz.
Braking Test
GoodFor Driver
AverageFor Driver
Here, the Jazz scores a 57 as compared to Baleno's 59. The Jazz falls in the Good (Score: 50-58) band while the Baleno falls in the Average (Score: 59-66) band. So, while the Jazz loses out on the acceleration front, it gains over the Baleno in terms of braking.